


MMEC Daily Report · Same-Session Scorecard
MMEC Report Scorecard — September 30, 2026: 7 Analyses Aligned
- BE bearish → -1.40%
- INT bullish → +1.15%
- AMD bullish → +1.11%
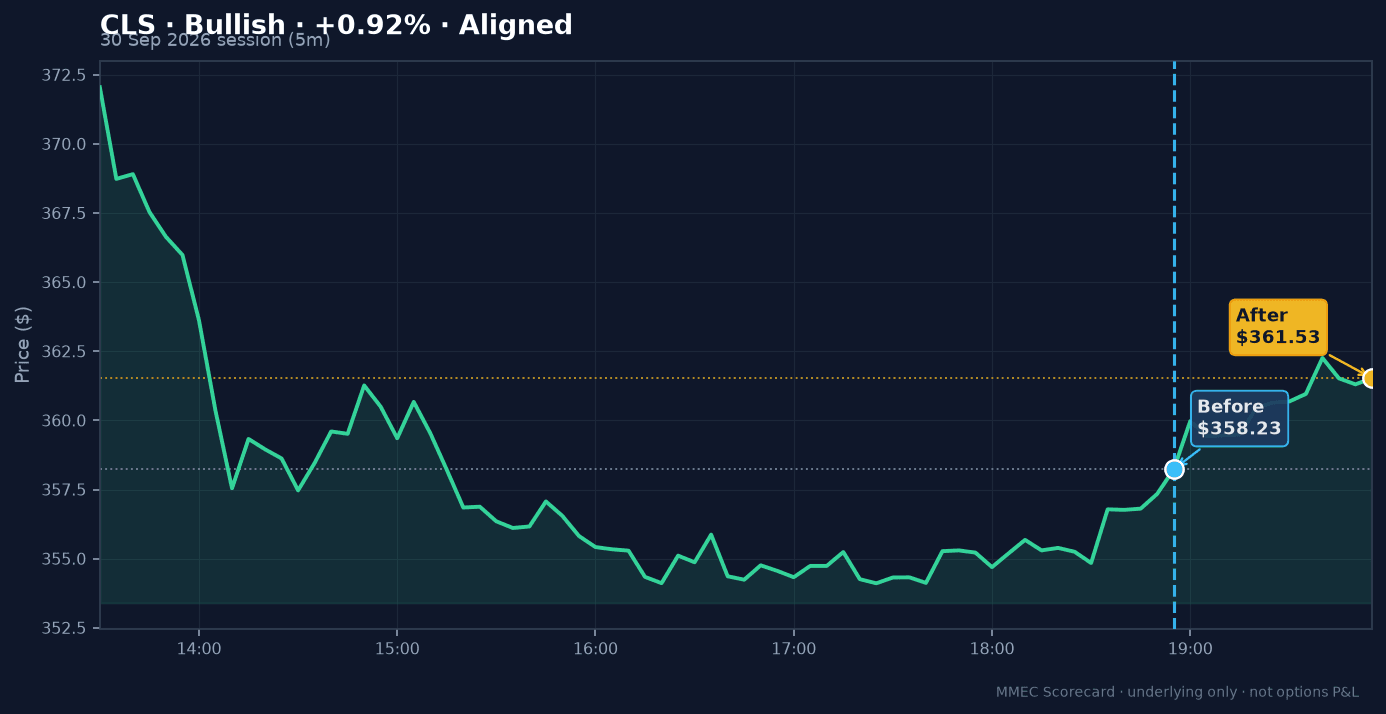
- CLS bullish → +0.92%
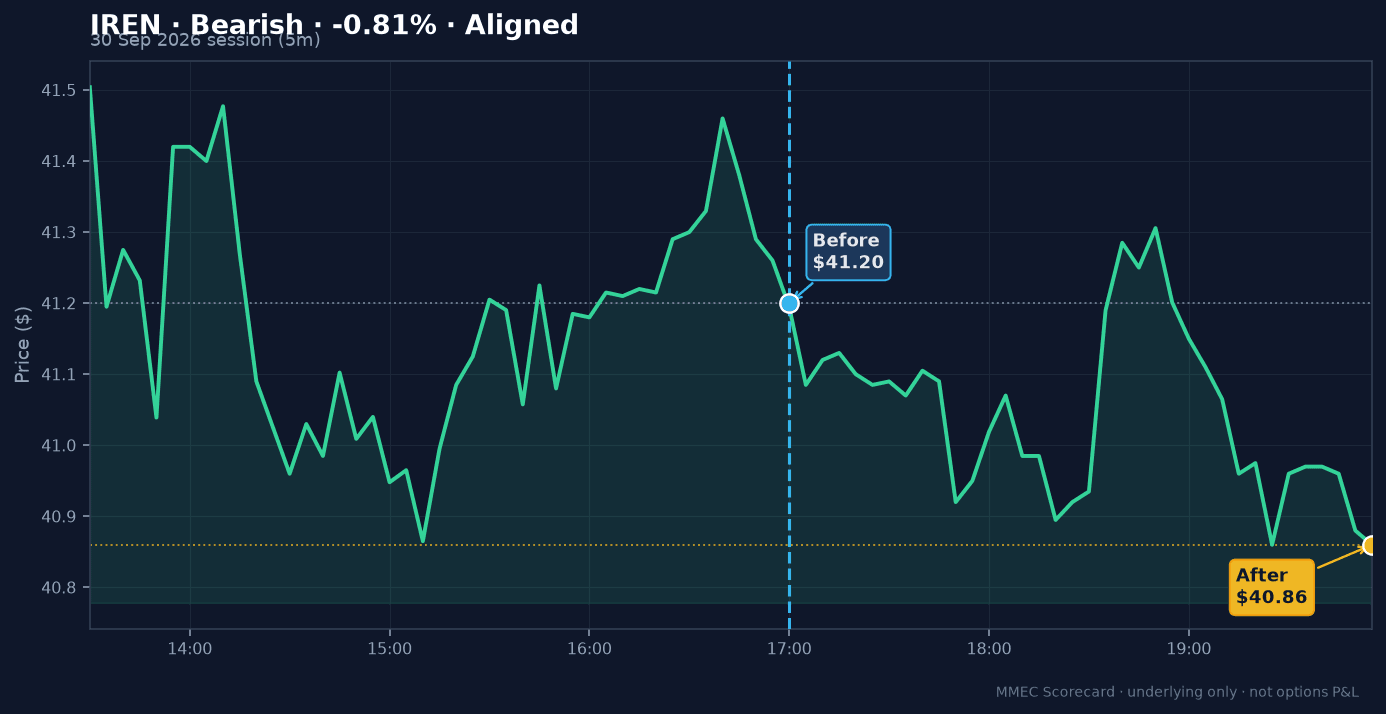
- IREN bearish → -0.81%
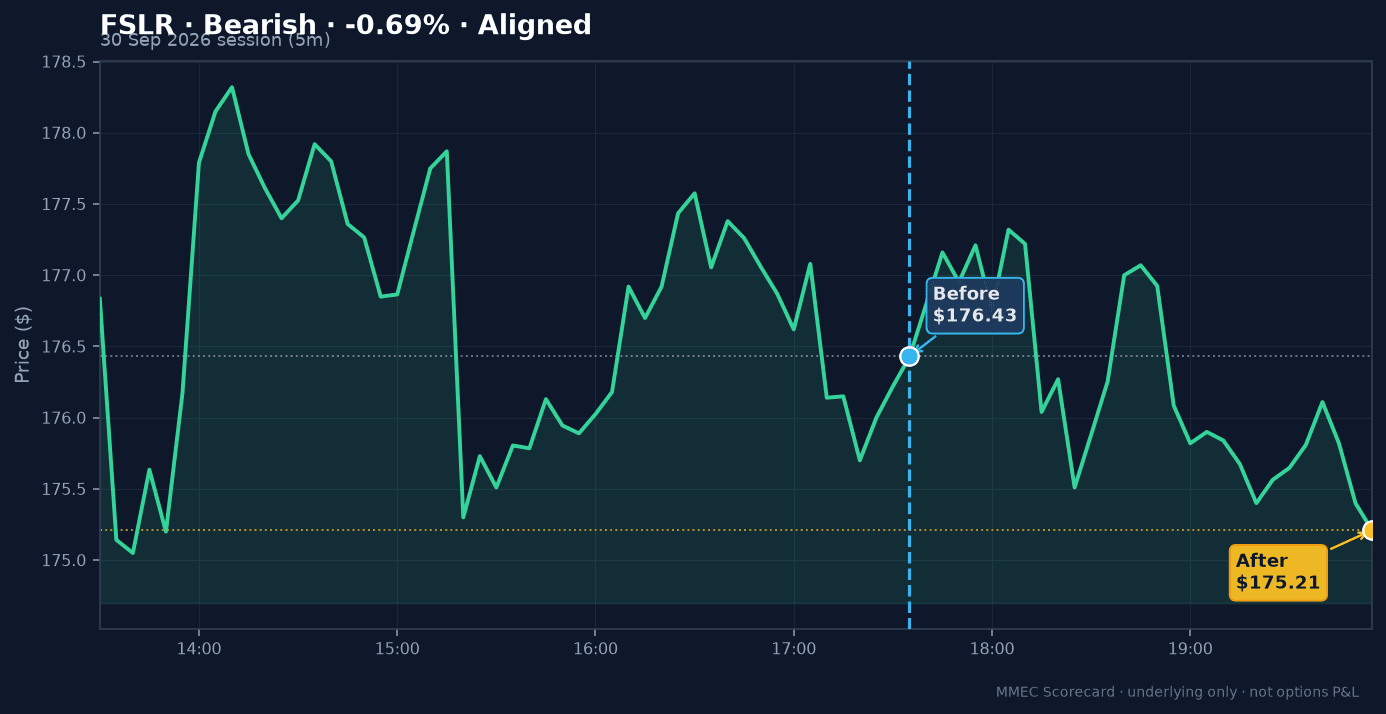
- FSLR bearish → -0.69%
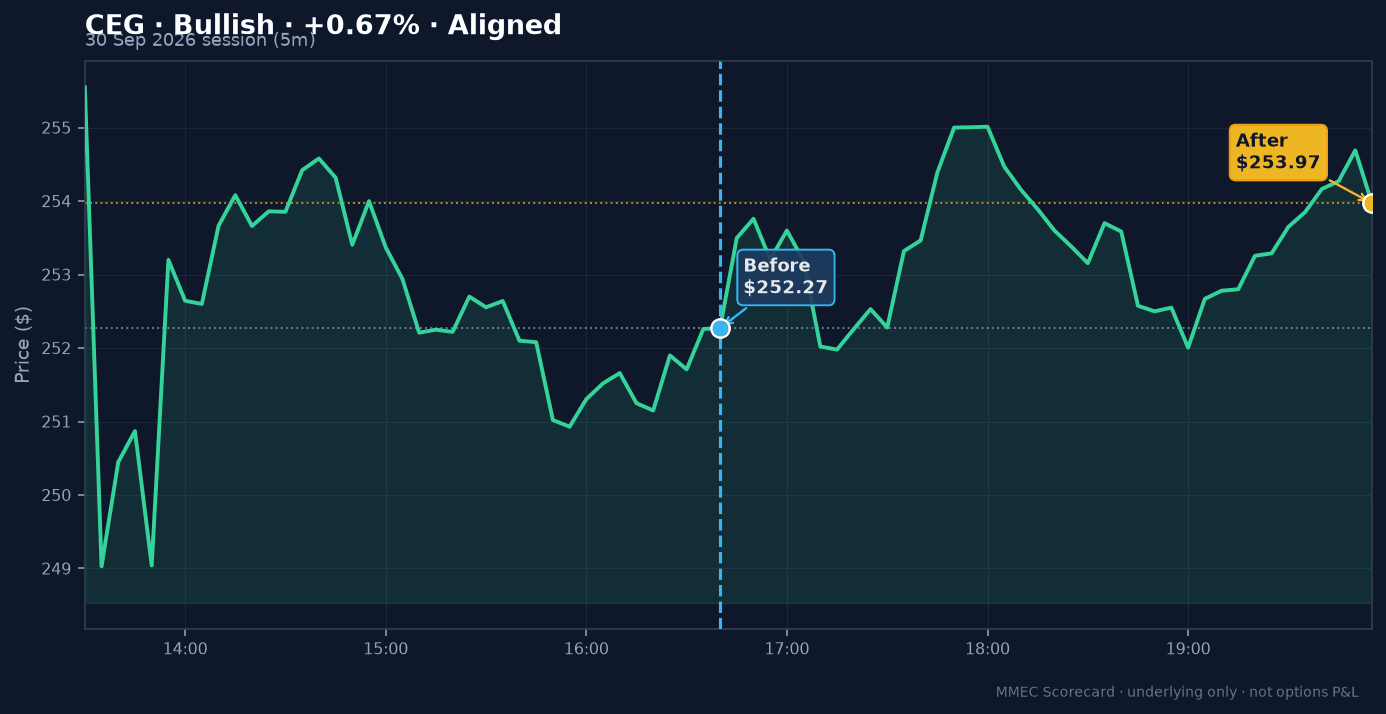
- CEG bullish → +0.67%
This scorecard is a structured post-trade review of published flow narratives versus spot — the kind of calibration desks run after the close. It is educational. It is not a performance guarantee.
Visual Snapshot — Before & After
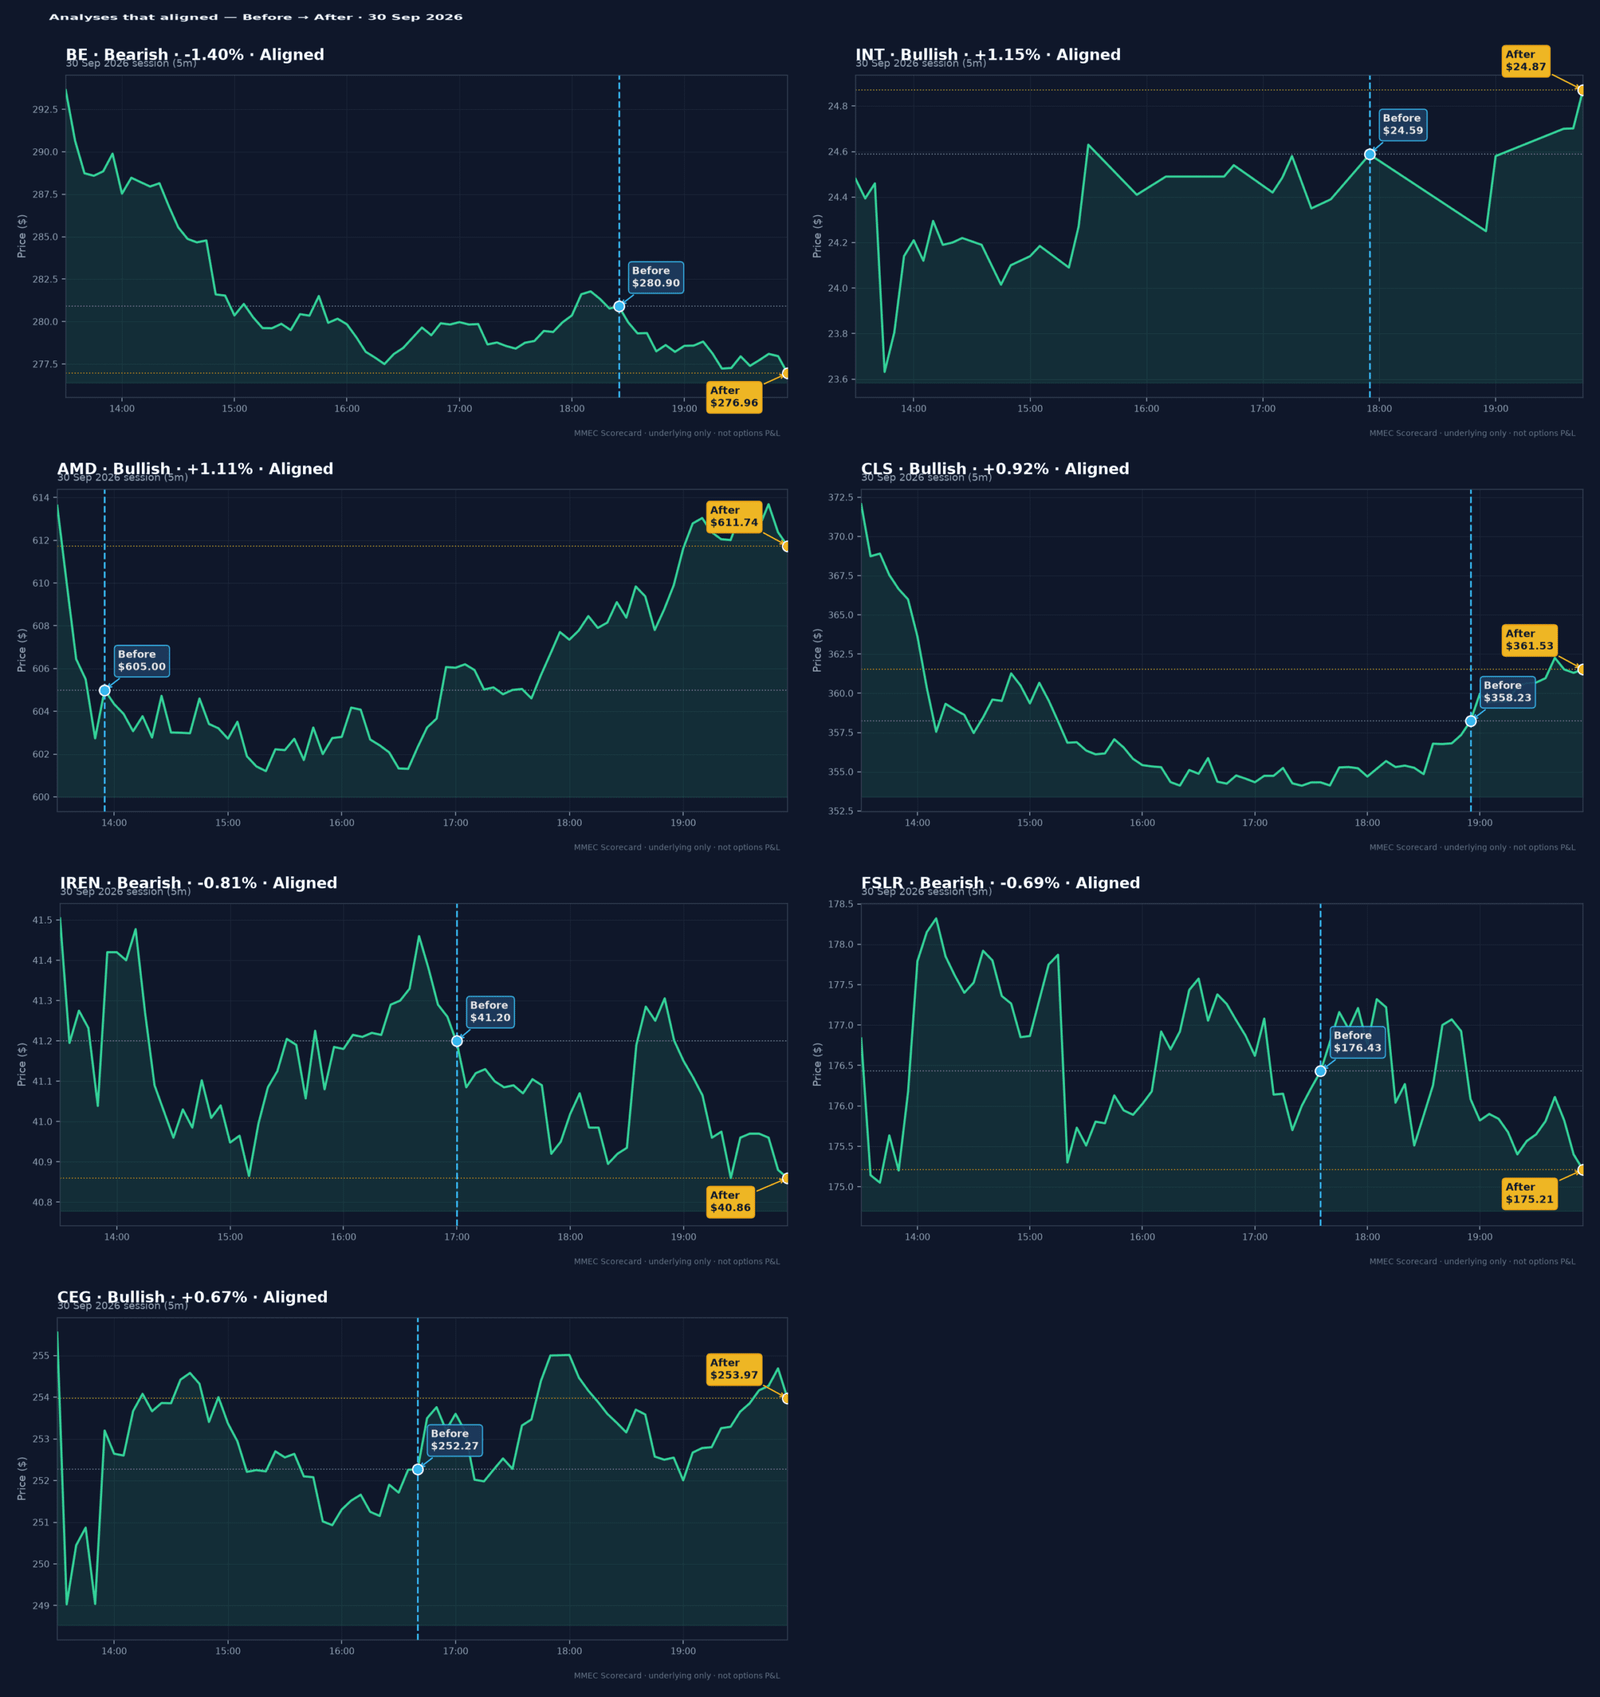
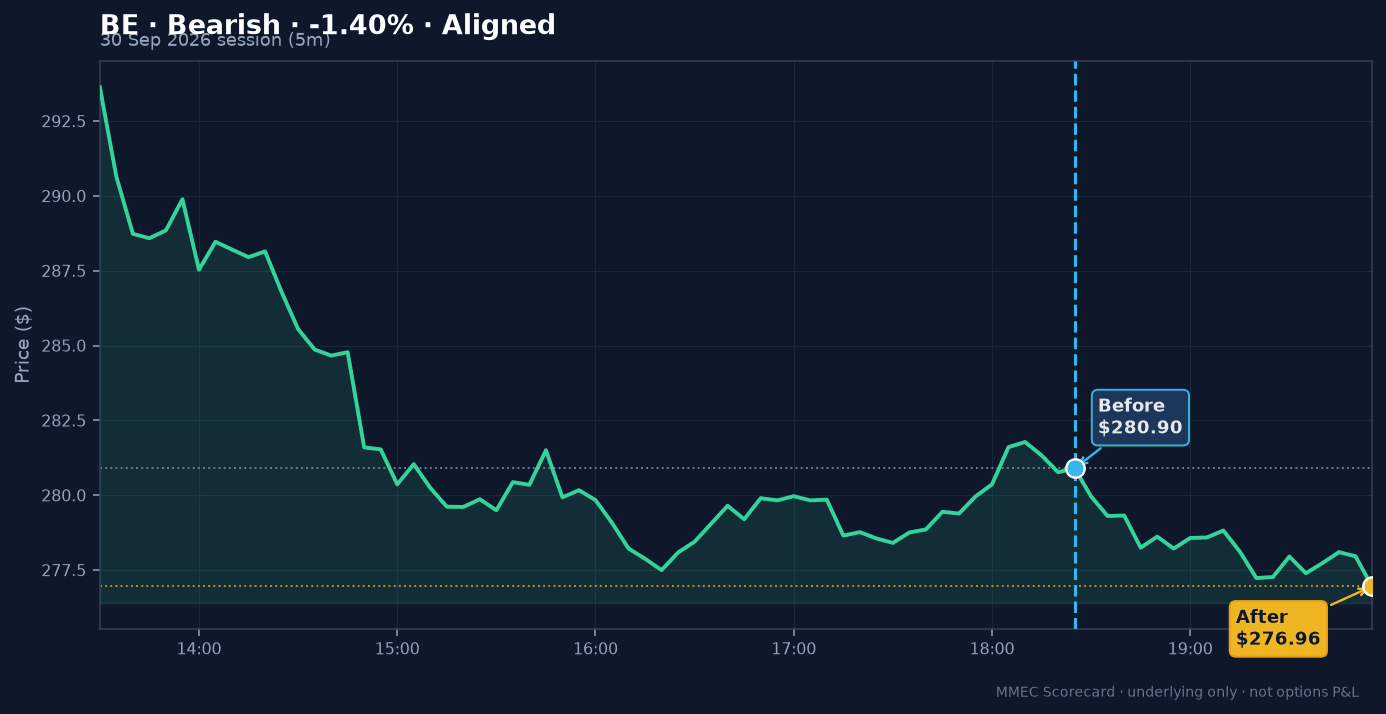
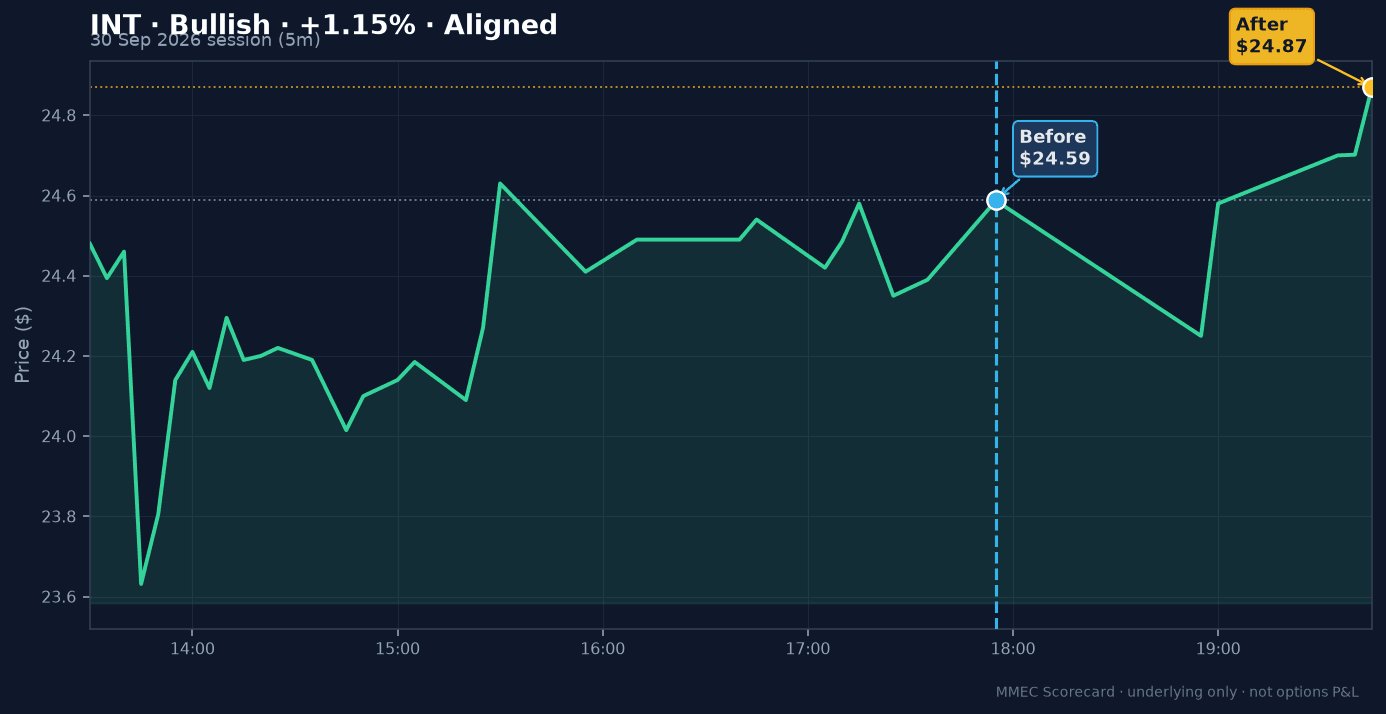
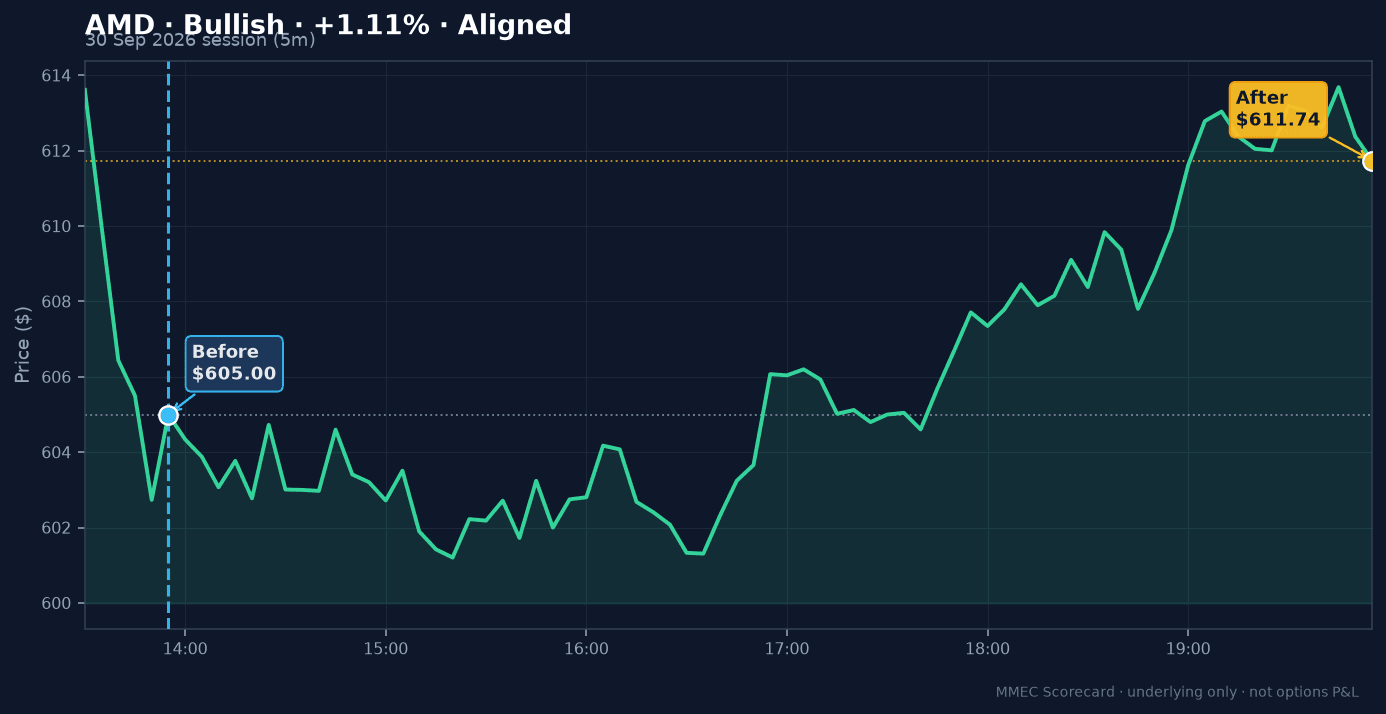
Session charts use 5-minute bars for 30 September 2026. The blue marker is the signal/entry print (Before); the gold marker is the session’s last 5-minute close (After).
Success Showcase — What Worked
7 tickers moved in the implied direction with an absolute move of at least 0.15% by the September 30 close:
| Ticker | Implied | Δ % | Outcome |
|---|---|---|---|
| BE | Bearish | -1.40% | Aligned |
| INT | Bullish | +1.15% | Aligned |
| AMD | Bullish | +1.11% | Aligned |
| CLS | Bullish | +0.92% | Aligned |
| IREN | Bearish | -0.81% | Aligned |
| FSLR | Bearish | -0.69% | Aligned |
| CEG | Bullish | +0.67% | Aligned |
BE led the session: bearish flow, then a -1.40% move from 280.90 to 276.96. INT closed +1.15% with the bullish report bias (24.59 → 24.87). AMD closed +1.11% with the bullish report bias (605.00 → 611.74). Also aligned: CLS +0.92%, IREN -0.81%, FSLR -0.69%, CEG +0.67%.
Still Pending
Several other clear-direction names from the day’s primary set remain below the same-session ≥0.15% favorable threshold. We treat those as still pending on this educational window — not as a catalog of non-wins. Overnight and multi-day impact are outside this scorecard.
How We Read the Day
- Eligible signals: Sovereign whale Call/Put Buying, inferable vertical packages, and Market Intent Equity Spotlight call/put demand.
- Clear direction only when one side’s notional exceeds the other by more than 1.5×; names under $300k directional notional dropped; cash indices skipped.
- Aligned = move in the implied direction with |%| ≥ 0.15% from entry 5m close to the session’s last 5m close.