

MMEC Analysis — Tuesday 10 November 2026: SPX Sits Just Above Its Gamma Flip
Platform figures below reflect Monday 9 November’s close, as read on the morning of Tuesday 10 November.
Yesterday in brief
Monday reversed last week’s pressure: the S&P 500 jumped 2.35% to 7,549.94, the Nasdaq 100 rose 3.40% to 27,907.63, and the Russell 2000 added 3.15% to 2,840.81. The bounce was led by AVGO, which added 19.6 basis points to the S&P move, then AAPL (+19.4), MSFT (+17.3), AMD (+15.5) and AMZN (+12.0). NVDA was the clear exception, subtracting 30.9 basis points even as the index rallied, with smaller drags from PM (−1.2), XOM (−0.7), CVX (−0.6) and ACN (−0.6).
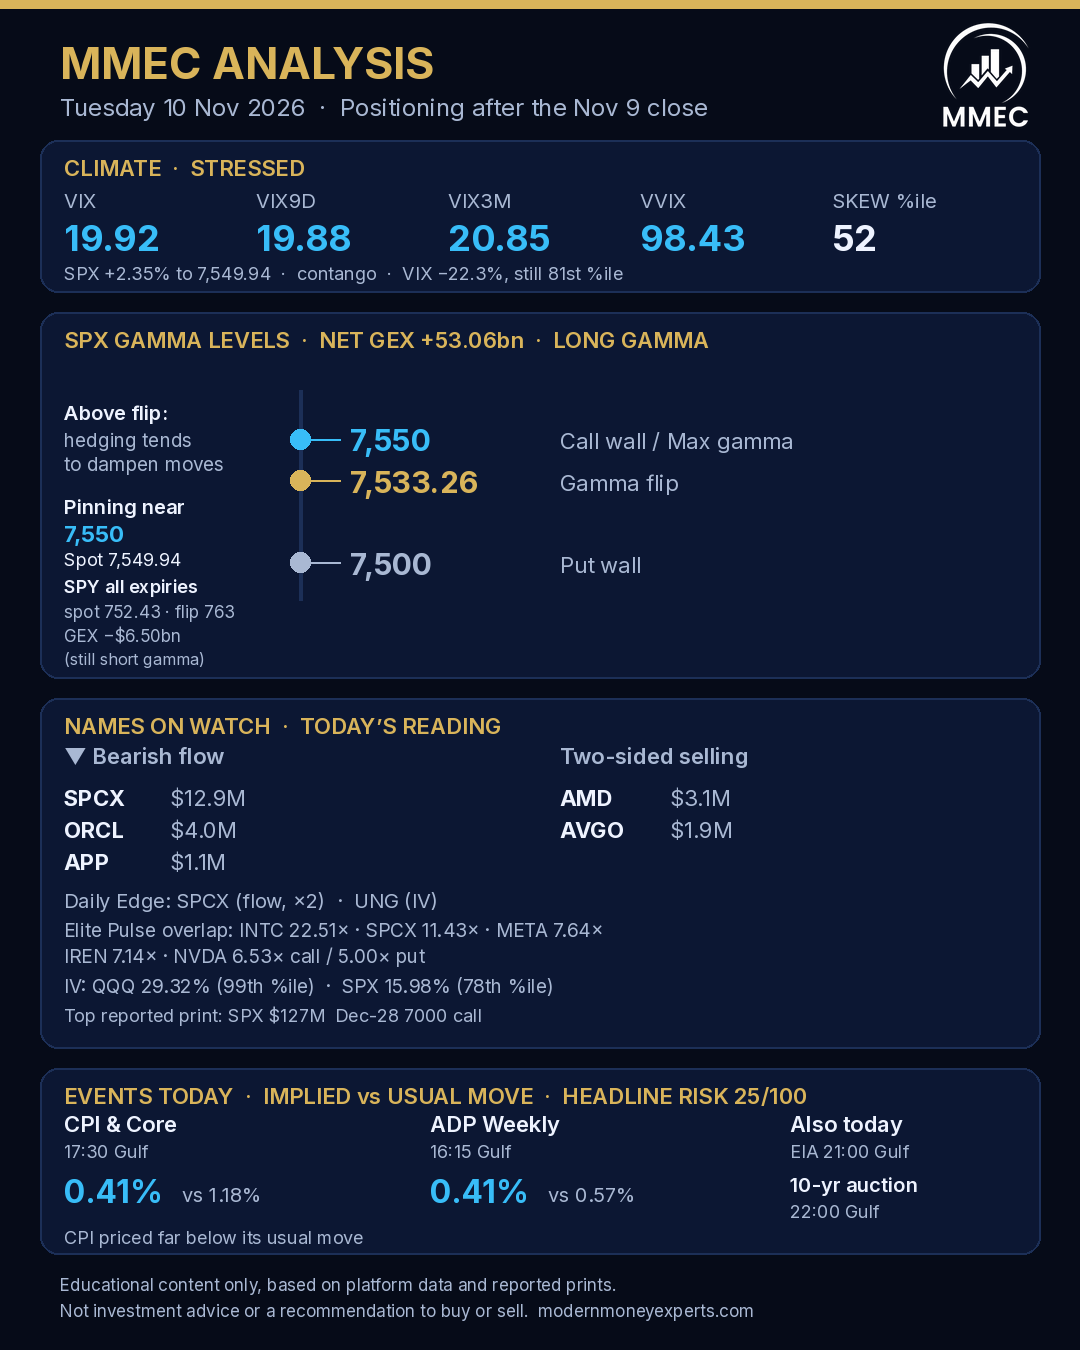
Volatility was crushed, but it was not reset. VIX dropped 5.72 points, or 22.31%, to 19.92 — yet it still sits in the 81st percentile of the past year, and the platform’s climate remains “Stressed”. The market brief describes volatility as high and protection as in demand, with index implied volatility below the forecast of realised volatility. The curve is in modest contango (VIX3M/VIX at 1.047), while the short end is flat (VIX9D/VIX at 0.998). VIX9D is 19.88 and VIX3M is 20.85. SPX 25-delta skew is 6.31, only the 52nd percentile of the past 60 days — mid-range, not the elevated protection reading of late October. VVIX fell 23.51 points to 98.43. Headline risk is 25/100, “Calm”, after a 27.2-point drop over 24 hours.
Today’s positioning: gamma levels
That mix — a sharp bounce, a deep vol decline, and a climate that is still Stressed — now sits against a different gamma map. Gamma exposure is built from open interest, so it maps out where hedging flows are likely to sit today. After Monday’s 173-point rally, SPX closed at 7,549.94, about 17 points above the gamma flip at 7,533.26 and a fraction below the call wall and max gamma, both at 7,550. Net GEX is +53.06bn. Above the flip, dealers are long gamma, so their hedging tends to dampen moves rather than amplify them, and price often pins near a nearby wall. That wall is now 7,550, with the put wall at 7,500. The flip itself barely moved (7,533.74 at the open, 7,533.26 at the close), while the call wall and max gamma climbed toward the close.
SPY, measured across all expiries, tells a different story, and that divergence should be stated plainly. Spot is 752.43, below the flip at 763, with net GEX of −$6.50bn, a call wall at 770 and a put wall at 750. Near-term SPX positioning is in positive gamma above the flip; the all-expiry SPY reading remains in negative gamma below its flip. Those two frames should be held together, not collapsed into one.
Names on watch
The figures below are today’s platform reading of Monday’s flow, not trade structures or recommendations. After Monday’s close, Daily Edge showed three candidates: SPCX twice, both in the bearish flow lane, and UNG in the implied-volatility lane. Flow Watch recorded 211 institutional prints across 72 names. The largest tagged group was SPCX, with $12.9M of bearish flow. ORCL showed $4.0M of bearish flow and APP $1.1M. Two-sided selling appeared in AMD ($3.1M, 16 prints) and AVGO ($1.9M).
Among reported prints on Monday’s tape, SPX led all underlyings with $12.70B in premium, ahead of SPXW ($11.94B), SPY ($8.50B), QQQ ($5.86B), NVDA ($4.51B), AAPL ($2.91B), AMZN ($1.21B) and TSLA ($914M). The single largest print was a $127M SPX 7000 call for December 2028, traded on the bid. It was followed by a $68M SPX 7000 call for January 2027, a $58M SPX 8000 put for December 2028, a $58M SPX 7000 call for 20 November, then KLAC 200 puts for February 2027 ($43M, with further $33M and $32M prints), a $31M SLV 205 put for January 2027, and a $26M QQQ 750 put for 20 November.
Pattern match: Elite Pulse
Some of Monday’s unusual activity overlaps with names our daily scorecard has recently reported as aligned: SPCX and IREN (Friday 6 November), META (Thursday 5 November), NVDA (Wednesday 4 and Thursday 5 November), AMD and MSFT (several sessions last week), and INTC (Monday 2 November). The figures below are reported prints and relative volume, not a recommendation to buy or sell.
INTC led the Elite Pulse board on relative volume, with call buying at 22.51× usual volume and $1.3M in premium. SPCX, an aligned name on Friday, showed put buying at 11.43× and $3.7M, plus a $7.1M print of unknown side at 5.71×, further put buying at 3.83× ($346K), and put selling at 1.76× ($1.3M). META printed at 7.64×, with call selling of $11M, $5.5M and $1.3M alongside $3.7M of call buying. IREN showed call buying at 7.14× ($195K). NVDA was two-sided near the top of the board: call buying at 6.53× ($4.5M) and put buying at 5.00× ($4.7M).
Outside that overlap, notable relative-volume prints included ETOR call buying at 5.71× ($700K), AAPL call buying at 4.85× ($306K), DAL call selling at 4.51×, AMZN put selling at 4.29× and 4.15× ($1.4M) with put buying at 4.15× ($1.7M), CBRS put buying at 3.93× ($1.1M), CRWV put and call buying at 2.86× (about $0.9–1.0M), ORCL call selling at 2.86× ($1.8M) and UBER call selling at 2.86× ($1.5M). ORCL also appeared on Flow Watch with $4.0M of bearish flow, and was a recently aligned scorecard name on 5 November.
On implied volatility, QQQ IV is 29.32%, down 3.06 points, with an IV rank of 80.22% and an IV percentile of 99.21%. SPX IV is 15.98%, down 3.69 points, with an IV rank of 69.25% and a percentile of 78.35%. Even after Monday’s decline in implied volatility, QQQ remains near the top of its own history.
Event calendar
Today’s calendar is led by US inflation data, and the options market is pricing a much smaller reaction than history would suggest. ADP’s weekly employment change is due at 16:15 Gulf time (12:15 UTC), with an implied move of 0.41% against a 0.57% historical average. US CPI and Core CPI follow at 17:30 Gulf time (13:30 UTC): the implied move is 0.41%, against a historical move of about 1.18–1.19%. That gap is the main event risk today. Near-term SPX gamma is positive, so hedging flows are more likely to dampen moves than to amplify them — which makes the distance between a 0.41% implied move and a typical CPI reaction the figure to watch. The EIA Short-Term Energy Outlook is due at 21:00 Gulf time, and a 10-year note auction at 22:00. Headline risk scores 25/100, “Calm”.
Educational content only, based on MMEC platform data and reported prints. Not investment advice or a recommendation to buy or sell any security.